 |
|
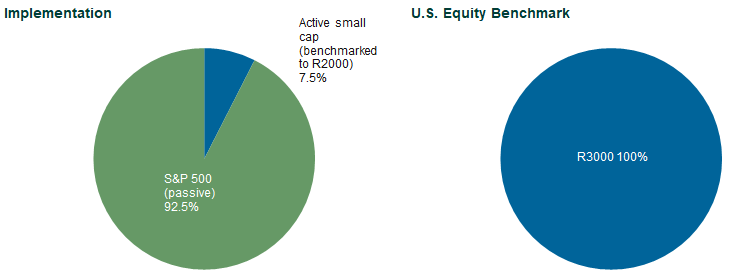
We recently worked with a client as it was evaluating a passive investment in large cap U.S. equity. After a discussion about the two most common indices used to represent the large cap U.S. equity market and what would be most appropriate for this investor, a committee member made a very interesting observation: “It sounds to me like selecting an index to track is an active decision.” At first blush, the main large cap indices do not seem all that different. The S&P 500 Index shares a correlation of 0.997 with the Russell 1000 Index, two of the most prominent large cap indices (and as their names indicate, one tracks the top 500 stocks by market capitalization, with some exceptions as I will describe later, and the other the top 1,000). But it turns out they can be quite different, and looking at them through the lens of calendar year 2020 returns validates this statement. Choosing an index series for your passive manager to track can indeed be an active decision. When an index provider does anything to exclude companies offered by the broad “market,” that decision can lead to different outcomes. The S&P 500 is seen by many market participants as the large cap index, because it is one that stakeholders readily recognize. It has also proven to be a hard index for active large cap managers to beat. While it is a reasonable index for benchmarking … it is not “the broad market” as it excludes companies that do not meet its profitability criteria. This dynamic is demonstrated by a hypothetical investment structure that imitates many institutional U.S. equity implementations: |
|
|
|
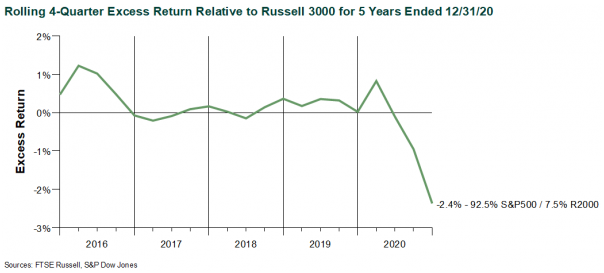
The structure above envisions passive large cap equity (benchmarked to the S&P 500), and active management for small cap equity (collectively benchmarked to the Russell 2000). Like so many institutional investors, this committee benchmarks its total U.S. equity allocation to the Russell 3000. In 2020, the S&P 500 gained 18.4%; the Russell 2000 rose 20.0%. Combine the two and you should be close to your total U.S. equity benchmark, the Russell 3000. But the Russell 3000 beat both large and small cap benchmarks with a return of 20.9% for the year. Unless this program had a small cap manager, or managers, that outperformed the benchmark Russell 2000 by 32% in 2020, this structure underperformed the Russell 3000 Index. In other words, by selecting the S&P 500 instead of the Russell 1000 for its large cap exposure, this investor was left with near-term underperformance. |
|
|
|
The performance differences in 2020 were unique for a couple of reasons. The first is Tesla, which was included in the Russell 1000 index, but not the S&P 500 until December. Tesla had a calendar year-to-date return of close to 700% before it was included in the S&P 500. And there were other companies that are included in Russell but not in the S&P that helped drive this performance difference. The S&P 500 excludes those that do not meet a financial viability hurdle; Russell has no such exclusion. Many unprofitable technology companies also saw outsized gains in 2020, leading to a divergence between the two indices. To be included in the S&P 500 (and the S&P Composite series) a company must exhibit financial viability in the form of four straight quarters of GAAP profits. However, by requiring a company to turn a profit, the index provider has taken the first step toward making an active management decision. Why stop there? Why not also exclude companies that have unserviceable levels of debt? And here we begin walking down the slippery slope to alternative beta—effectively making active decisions about passive implementation. This is not to express the opinion that asset owners shouldn’t favor companies that are profitable or viable. This is just to make the point that if an institutional investor is seeking to replicate the broad market return, it needs to accept all that the broad market provides. The takeaway for fiduciaries: know your indices. All have subtle differences that might lead to performance differences like those experienced in 2020. FTSE Russell, S&P Dow Jones, MSCI, and CRSP all have different capitalization definitions for large, mid, or small cap. As a practical matter, the most notable difference between S&P and all the others is the profitability criteria. While 2020 was extreme, this criteria will likely create more issues with benchmarking going forward. Indexing best practices:
|
|
|
|
Callan is a Consultant member of TEXPERS. Follow TEXPERS on Facebook, Twitter and LinkedIn as well as visit our website for the latest news about Texas' public pension industry. The views expressed herein do not constitute research, investment advice or trade recommendations and do not necessarily represent the views of Callan and are subject to revision over time. |
Jun
29
Share this post:


