Why the End of Monetary Accommodation Could Be a Tailwind for Active Bond Investors
The north star of active bond management is simple: avoid losing money. Over the last eighteen months, that proved quite easy to accomplish. In the period since credit spreads hit their pandemic-highs, outperforming has proved reasonably straightforward as long as investors stayed overweight the market. Unprecedented central bank and fiscal support has driven a swift bounce back in economic activity that has resulted in positive returns for credit market investors (and investors in risk assets of almost every stripe). But as the Fed looks to withdraw monetary accommodation, and fears about inflation, record debt levels and uneven and unstable recoveries intensify, investors could be forgiven for thinking that the outlook will be much more challenging in the year ahead.
Volatility, however, can be an active bond investor’s friend, especially if the manager’s investment process focuses on inefficiencies in the credit markets and ratings process. For managers that primarily source active risk by credit selection within and across sectors, dispersion in each issuer's excess returns is a major tailwind. It is in times when there is little differentiation in sector and issuer performance that it is more difficult for this type of process to add significant value. Comparatively, in low dispersion or trending markets, investment approaches that focus on identifying the macro direction of the bond market can be additive.
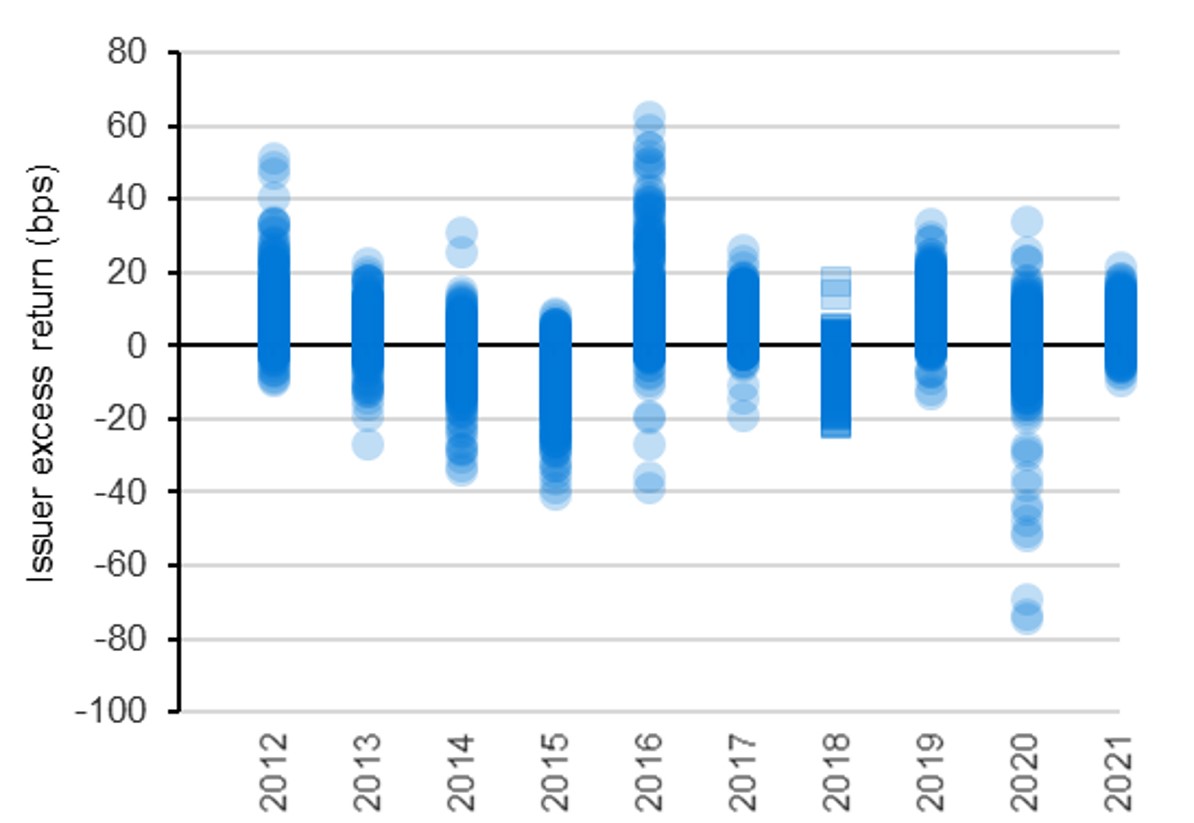
When markets experience more volatility, the dispersion in issuer excess returns, as well as the dispersion in security valuations, naturally increase. This is when active managers can prove their worth by navigating choppy waters. Figure 1 shows the historical dispersion of excess returns of issuers within the Bloomberg US Long Credit universe. While the dispersion of excess returns in 2021 was relatively muted, we believe that the prospect of greater volatility and dispersion within and between industries next year will increase the opportunities to add meaningful alpha. The regime change from benign government-led COVID-19 recovery experienced in 2021 to the more uncertain next stage could prove a boon for credit investors seeking outperformance.
Figure 1: Bloomberg Long Duration US Credit Index – Historical dispersion of issuer excess returns1

Source: Bloomberg as of November 30, 2021.
Absolute vs. relative dispersion
Though market commentators frequently place a myopic emphasis on absolute spread dispersion, this focus obscures the more relevant measure of relative spread dispersion, which can help to identify areas of opportunity. Investment grade credit spreads reached historical tights this year, trading within a 20 basis point range.2 It is not surprising then that our models are showing that dispersion (to which when we refer now on means spread dispersion) has been near historical lows on an absolute basis for portions of the investment grade credit universe.
In other words, if one were to glance at a graph of absolute dispersion, it may understandably be mistaken as a graph of the level of credit spreads. In fact, for 30-year and 10- year BBB credits, absolute dispersion between sectors began this year in the 7th and 11th percentiles, respectively, as measured over the last twenty years.2
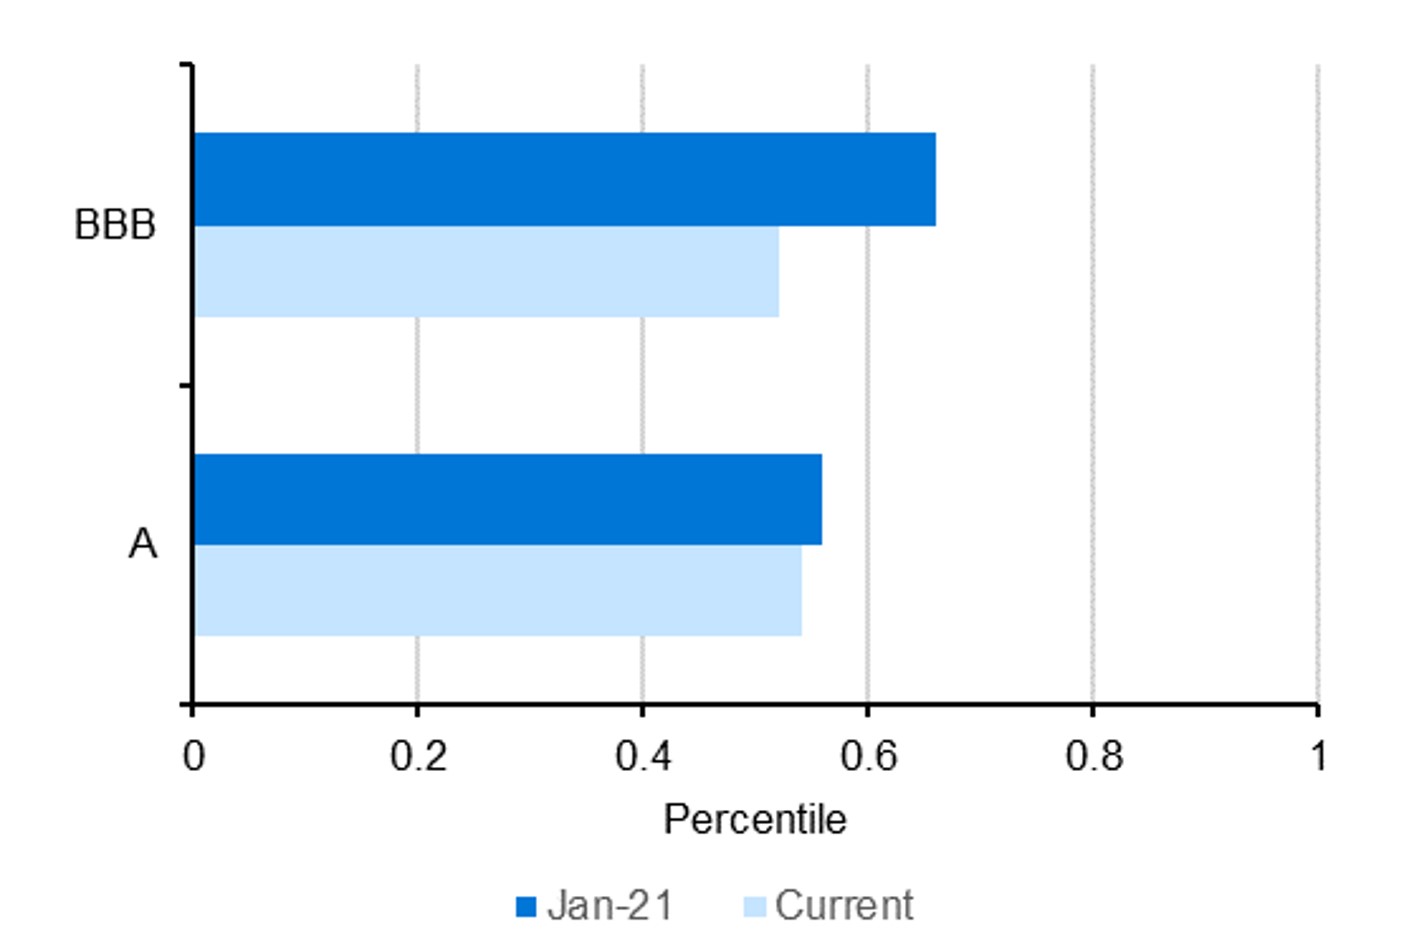
Relative dispersion, which includes an adjustment for the level of credit spreads, provides a complementary measure at which to look. Figure 2 focuses on the 10-year point and depicts the trends in relative dispersion this year among issuers within sectors. We center our attention here on the 10-year maturity since we believe the 30-year point has been subject to stronger technicals such as Asian buying and LDI (liability driven investing) activity over the past year. As the year has progressed, Figure 2 shows that dispersion among issuers has declined, but looking back over the last 20 years, relative intra-sector dispersion is still near the 50th percentile.
Figure 2: Relative 10-year intra-sector spread dispersion3

Source: LGIM America, Bloomberg as of November 30, 2021.
This intra-sector compression, most notable in BBBs, generally benefited an active management style with an emphasis on concentration in high conviction credit stories that played out over 2021.
Outlook for 2022 and beyond
Looking forward to next year, investors face looming risks on the horizon: new variants, tapering, elevated corporate debt issuance, fears of inflation, rising US-China tension, battered supply chains, instability in EM and financial excesses. Volatility is likely to rise as a result of these risks. What does this mean for dispersion and active management?
All else equal, we expect greater dispersion and volatility should provide more opportunities for active managers to add value. Active managers who stay ahead of these market risks while balancing asset allocation and security selection may find more plentiful opportunities to add alpha in 2022.
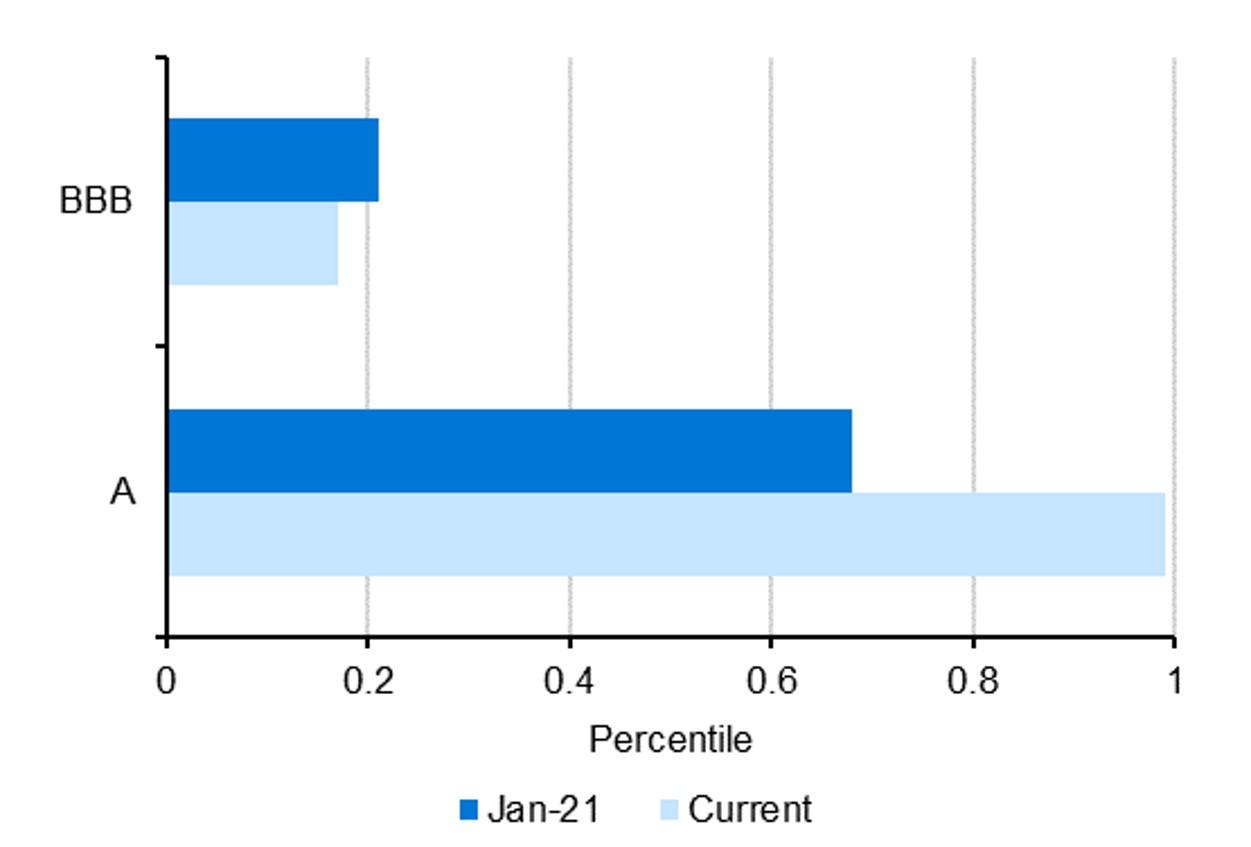
The market data also suggests that this year may provide more opportunities to focus alpha generation around sector bets. Figure 3 depicts how relative dispersion between sectors for A-rated credits has increased dramatically this year (to the 99th percentile). We believe this has driven primarily by a general widening of the distribution of valuations across different industry sectors, with no specific sectors causing the shift.
Figure 3: Relative 10-year inter-sector spread dispersion3

Source: LGIM America, Bloomberg as of November 30, 2021.
The key takeaway in our opinion is that, despite the ominous headlines and forecasts for next year, volatility and dispersion are not to be feared, but rather embraced. As we near the inflection point in monetary policy—and end to quantitative easing in the US—we anticipate that opportunities for excess return generation will improve further. When the tide stops rising and lifting all boats, choosing winners and losers becomes increasingly crucial. We believe bond investors should remain confident that active managers who can navigate the turbulence still have the opportunity to add value in their portfolios.
Sources:1. As of November 30, 2021. Excess return values presented are based on the Bloomberg US Long Credit Total Return Index Unhedged USD.2. Source: Bloomberg as of December 8, 2021 as reflected by the. Bloomberg US Long Credit Total Return Index Unhedged USD.3. Values presented are based on the 10 yr (using the 8.25-11 yr tenor) and 30 yr (using the 25-32 yr tenor) part of the curve of the Bloomberg US Long Credit Total Return Index Unhedged USD based on LGIMA proprietary models and calculations. Current = values reflect November 30, 2021. Disclaimer:Views and opinions expressed herein are as of the date set forth above and may change based on market and other conditions. The material contained here is confidential and intended for the person to whom it has been delivered and may not be reproduced or distributed. The material is for informational purposes only and is not intended as a solicitation to buy or sell any securities or other financial instrument or to provide any investment advice or service. Legal & General Investment Management America, Inc. does not guarantee the timeliness, sequence, accuracy or completeness of information included. Past performance should not be taken as an indication or guarantee of future performance and no representation, express or implied, is made regarding future performance. The material in this presentation regarding Legal & General Investment Management America, Inc. (“LGIMA”) is confidential, intended solely for the person to whom it has been delivered and may not be reproduced or distributed. The material provided is for informational purposes only as a one-on-one presentation, and is not intended as a solicitation to buy or sell any securities or other financial instruments or to provide any investment advice or service. LGIMA does not guarantee the timeliness, sequence, accuracy or completeness of information included. The information contained in this presentation, including, without limitation, forward looking statements, portfolio construction and parameters, markets and instruments traded, and strategies employed, reflects LGIMA’s views as of the date hereof and may be changed in response to LGIMA’s perception of changing market conditions, or otherwise, without further notice to you. Accordingly, the information herein should not be relied on in making any investment decision, as an investment always carries with it the risk of loss and the vulnerability to changing economic, market or political conditions, including but not limited to changes in interest rates, issuer, credit and inflation risk, foreign exchange rates, securities prices, market indexes, operational or financial conditions of companies or other factors. Past performance should not be taken as an indication or guarantee of future performance and no representation, express or implied, is made regarding future performance or that LGIMA’s investment or risk management process will be successful. In certain strategies, LGIMA might utilize derivative securities which inherently include a higher risk than other investments strategies. Investors should consider these risks with the understanding that the strategy may not be successful and work in all market conditions. Reference to an index does not imply that an LGIMA portfolio will achieve returns, volatility or other results similar to the index. You cannot invest directly in an index, therefore, the composition of a benchmark index may not reflect the manner in which an LGIMA portfolio is constructed in relation to expected or achieved returns, investment holdings, portfolio guidelines, restrictions, sectors, correlations, concentrations, volatility, or tracking error targets, all of which are subject to change over time. No representation or warranty is made to the reasonableness of the assumptions made or that all assumptions used to construct the performance provided have been stated or fully considered. All LGIMA performance returns in this presentation are presented gross of fees, but are accompanied with an explanation of performance net of investment management fees. The presentation may also include performance that is based on simulated or hypothetical performance results that have certain inherent limitations. Unlike the results in an actual performance record, these results do not represent actual trading. Because these trades have not actually been executed, these results may have under- or over-compensated for the impact, if any, of certain market factors, such as lack of liquidity. Simulated or hypothetical trading programs in general are also subject to the fact that they are designed with the benefit of hindsight. No representation is being made that any account will or is likely to achieve profits or losses similar to these being shown. Information obtained from third party sources, although believed to be reliable, has not been independently verified by LGIMA and its accuracy or completeness cannot be guaranteed. Unless otherwise stated, references herein to "LGIM", "we" and "us" are meant to capture the global conglomerate that includes Legal & General Investment Management Ltd. (a U.K. FCA authorized adviser), LGIM International Limited (a U.S. SEC registered investment adviser and U.K. FCA authorized adviser), Legal & General Investment Management America, Inc. (a U.S. SEC registered investment adviser) and Legal & General Investment Management Asia Limited (a Hong Kong SFC registered adviser). The LGIM Stewardship Team acts on behalf of all such locally authorized entities. © 2021 Legal & General Investment Management America, Inc. LGIM America is an Associate member of TEXPERS. The views and opinions contained herein are those of the author and do not necessarily represent the views of TEXPERS. These views are subject to change. Follow TEXPERS on Facebook, Twitter, and LinkedIn for the latest news about Texas' public pension industry.

